Introduction
Compiling and contrasting the data on various forms of violence between 2013 and 2015, this annual report examines various aspects of militancy and the outcome of counter-militancy strategies being pursued by the country under the National Action Plan (NAP) and the counter-terror Zarb-e-Azb operation.
To evaluate and assess the marked decline in violence, this report scrutinizes all incidents of violence, number of fatalities of anti-state actors, their victims, the identity of the victims and claimants of crime. It also reviews new methods of criminality and militancy that non-state actors deployed during the last three years and how terror and violence affect citizen’s lives.
All assessments and reviews are based on open source data, mostly national print and electronic media. CRSS endeavors to ensure that the data is as accurate as possible within the available resources. However, it does not rule out errors and omissions, which are always a possibility in such statistical work. Such mistakes, nevertheless, do not grossly affect the overall outcome and conclusions of this report.
Readers can approach CRSS for information related to this report. Alternately, you may want send your queries to mail@crss.pk, directly to Mohammad Nafees, Senior Research Fellow, CRSS – the author of the report (nafees@crss.pk) or Zeeshan Salahuddin, Senior Research Fellow (zeeshan@crss.pk).
Casualties of Violence in the Country
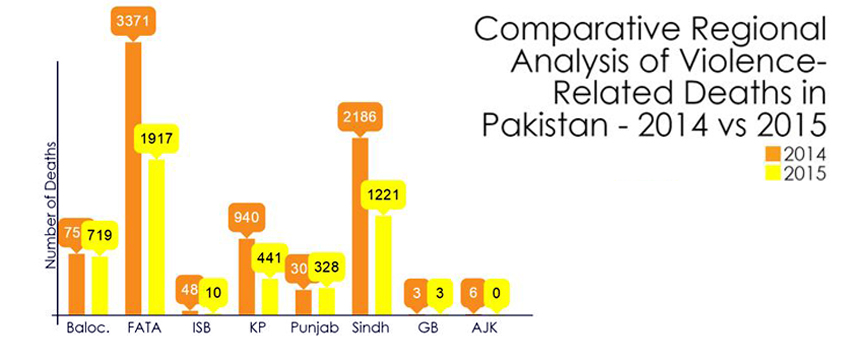
Casualties of violence in 2015 recorded a marked decline; from a loss of 7,611 persons in 2014, the number dropped to 4,653 persons this year, a fall of more than 40%. The Federally Administered Tribal Areas (FATA) topped the rest of the country in terms of fatalities, denoting a trend that began in June 2014 with the launch of the military operation Zarb-e-Azb in North Waziristan. The number of fatalities in the largest Punjab province, however, registered a slight increase with 328 deaths from various forms of violence.
| Table 01: Fatalities from violence by region – 2013 to 2015 | ||||||
| Province | 2013 | 2014 | 2015 | |||
| Fatality | Injury | Fatality | Injury | Fatality | Injury | |
| Balochistan | 949 | 1273 | 752 | 840 | 719 | 274 |
| FATA | 1460 | 1015 | 3371 | 714 | 1917 | 576 |
| Islamabad | 20 | 3 | 48 | 248 | 10 | 2 |
| KP | 1027 | 1707 | 940 | 1026 | 441 | 415 |
| Punjab | 122 | 293 | 305 | 342 | 328 | 319 |
| Sindh | 2084 | 1265 | 2186 | 765 | 1221 | 320 |
| Pakistani militants in Afghanistan | 0 | 0 | 0 | 0 | 14 | 0 |
| GB | 20 | 5 | 3 | 2 | 3 | 19 |
| AJK | 3 | 0 | 6 | 14 | 0 | 0 |
| Total | 5685 | 5561 | 7611 | 3951 | 4653 | 1925 |
Victims of Violence in Pakistan
Within last three years, as many as 17,000 persons succumbed to various forms of violence. This figure also includes more than 8,000 militants, criminals, and insurgents. A review of the last three years’ data reveals that the percentage of civilian fatalities continued dropping from 2013 onward, while the militants and criminals began suffering a greater number of casualties. Security and government official fatalities dropped by 45%. In this context a clear trend of diminishing civilian casualties is also visible, ostensibly because of the Zarb-e-Azb operation that targeted strongholds of Pakistani terrorist outfits in the Waziristan region, as well as the massive urban pacification operation underway in the southern port city of Karachi under the paramilitary Rangers, causing disruption to their activities, command and control centers.
A further dissection of the identity of the victims during the last three years also explains what kind of professions most of them were associated with. Among the civilians the identifiable people were found to be linked with political or religious parties or belonged to professions like private business, jurisprudence, education or health.
Fatalities of Civilians
Polio Workers
Within last three years, 59 persons affiliated with the polio eradication efforts in the country were killed, the majority of them targeted during 2014 (39). In 2015, 12 polio workers lost their lives.
Professionals
The term “professionals” refers to educationists, doctors, paramedics, media persons, academics and legal practitioners. Between the years 2013 and 2015, Pakistan lost at least 227 professionals. A January 3, 2015 report by the Pakistan Medical Association (PMA) disclosed that 54 doctors became victims of violence between 2010 and 2014, the majority of them targeted in Karachi on either sectarian or ethnic grounds, refusal to pay extortion or ransom, and associations with political parties. CRSS data for 2013-2015 shows as many as 53 doctors falling to criminal or political violence.
Businessmen
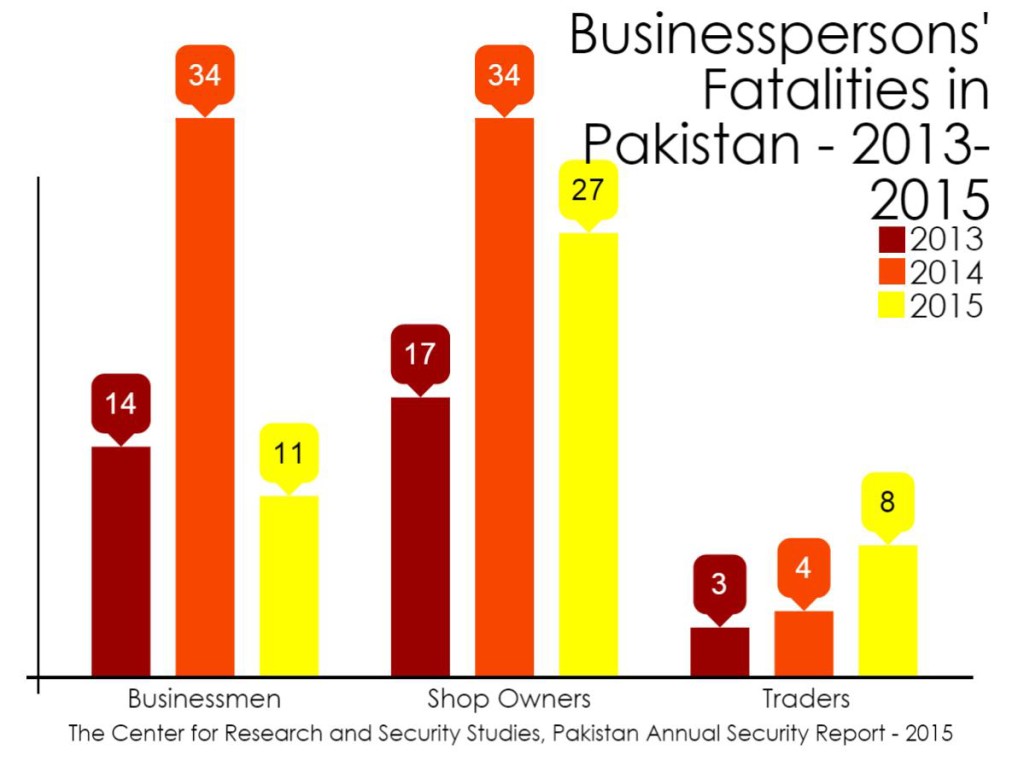
As many as 152 persons from the business community lost their lives from 2013 to 2015 but the figure of 2015 showed a sharp decline. Fatalities among office workers and laborers also declined during 2015.
Fatalities of Security Officials
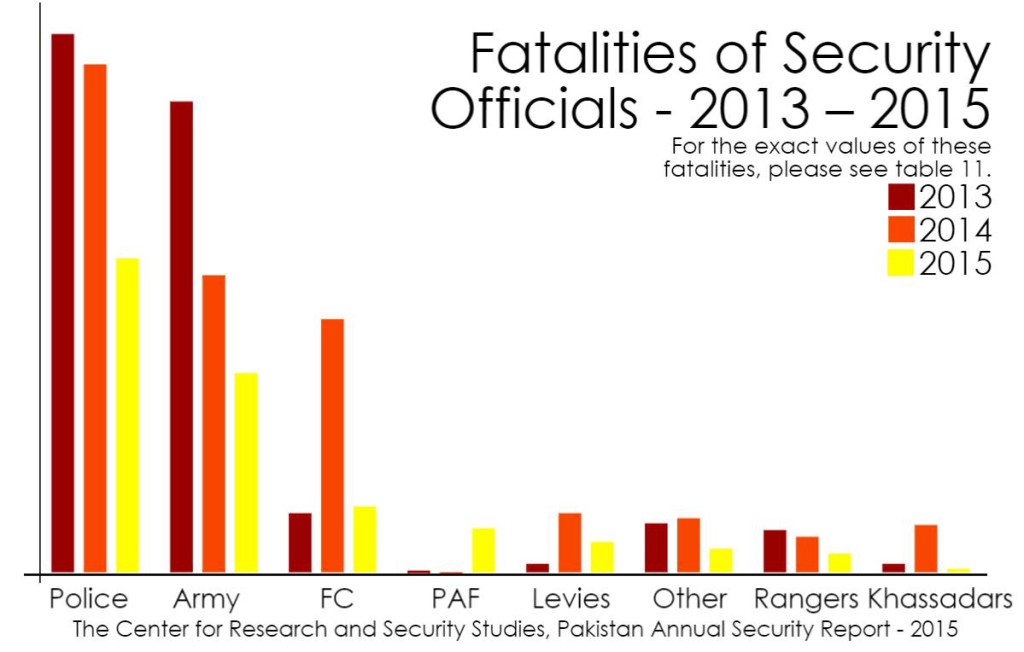
Within the last three years, security agencies lost 1,853 persons, over 40% of them police personnel. The number of security personnel who sustained injuries during this period was 2,108. Although Operation Zarb-e-Azb had begun in June 2014, a steeper reduction in violence-related fatalities was observed for security personnel, presumably because of the acceleration in national counter-terrorism efforts after the enactment of the National Action Plan (NAP).
The highest number of fatalities of security officials was observed in FATA (562) during 2013-2015, followed by Sindh (520), KP (414), Balochistan (288), and Punjab (53). The decline in fatalities of security officials was more than 40% while the political parties had a drop of 30% during 2015.
Fatalities of Militants, Insurgents and Criminals:
Militants:
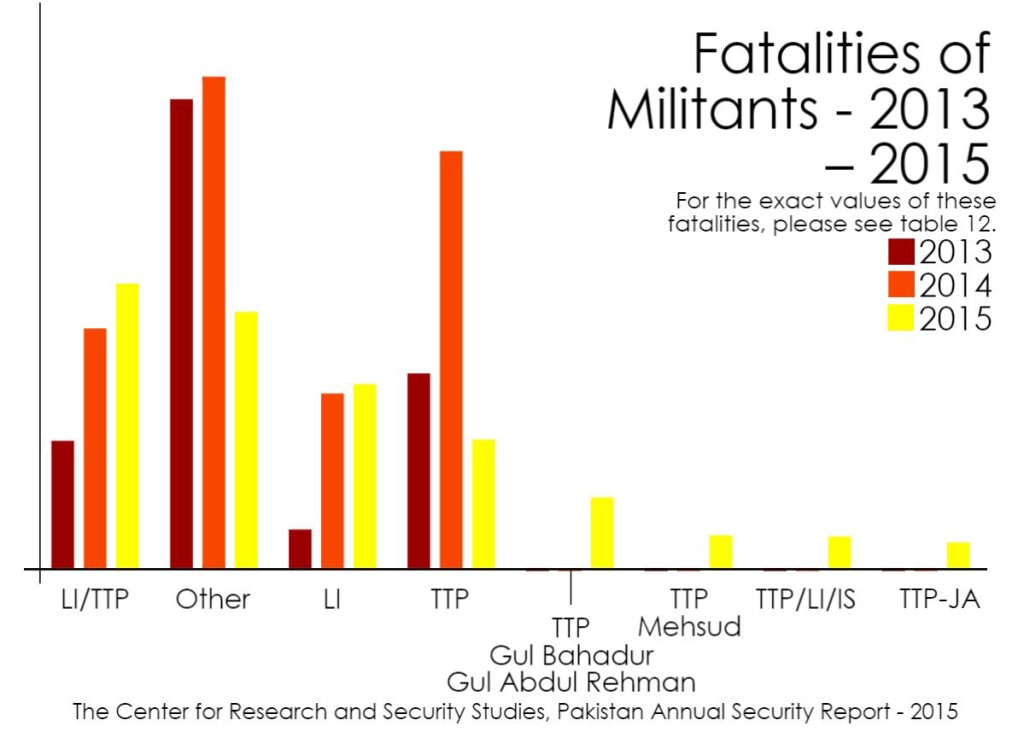
The last three years saw the elimination of 7,004 militants in different security operations and clashes between the militants and the security forces. A majority of them were reported killed in FATA (5,486), followed by Balochistan (535), Sindh (475), KP (397), Punjab (94), Islamabad (2), and AJK (1). The province of the Punjab had no casualty of militants in the year 2013 but in the following two years it witnessed a rise in their fatalities that climbed from 18 in 2014 to 76 in 2015. Compared to last year, the fatalities of militants in all provinces except the Punjab dropped during 2015.
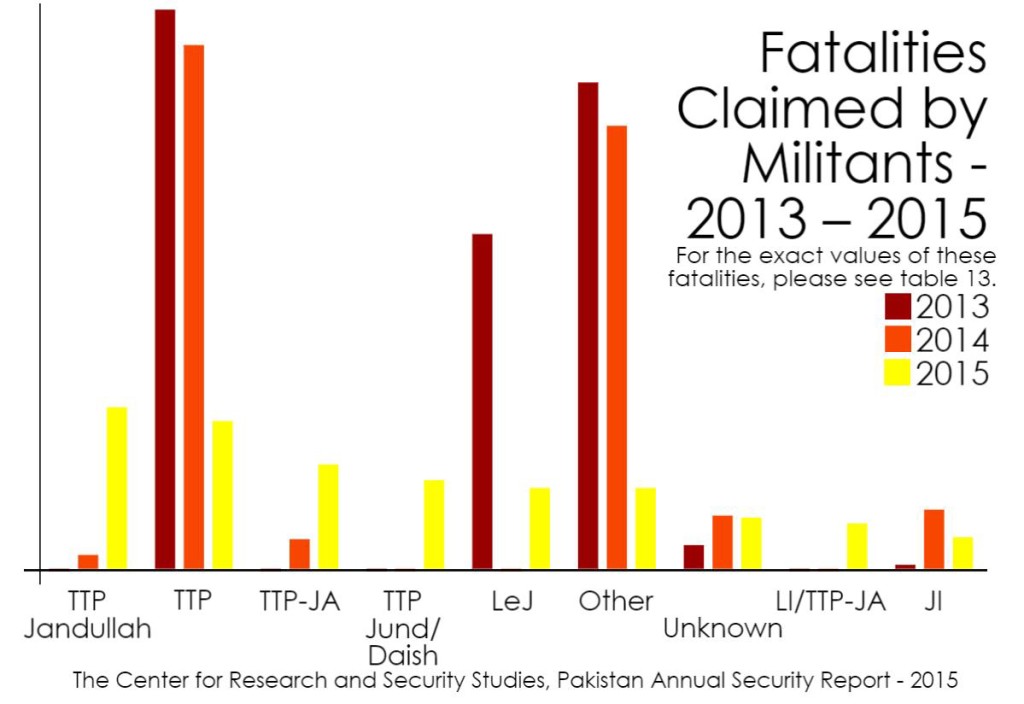
A majority of the militants remained unidentifiable with the exception of 2,683 of them who were found to have had links with different banned outfits. Nearly half of these identifiable militants were affiliated either with the Tehreek-e-Taliban of Pakistan (TTP) or its numerous splinter groups. In some cases, we have identified them as “attackers” involved in previous terror attacks (Example: Khanzada attackers, Wagah attackers, etc.) because no other identification was available.
Interestingly, a large number of new militant groups surfaced during the last three years. In 2013 only 27 groups had lost their militants. In 2014 this figure rose to 39 and in 2015 it stands at 43 groups. Only three groups of TTP (TTP, TTP-Gul Bahadur, and TTP – Gul Hasan) had suffered losses of their militants in 2013 and by the end of 2015 the number of TTP- affiliated groups had risen to 29.
A similar trend was observed in the number of militant groups that claimed attacks during these three years. Beginning from 11 outfits back in 2013, this number almost doubled to 22 – identifiable through the terror strikes they claimed to have carried out in 2015. However, some of the splinter groups like TTP-Khorasani, TTP-Ansarul Mujahideen, TTP-Junood Hifsa, and TTP-Lashkar-e-Jarrar apparently suffered no casualties during these three years.
Another surprising observation is that different groups kept changing their modus operandi from active to non-active mode at different period of time indicating that they keep adapting their terror tactics as and when the situation so demands.
Insurgents:
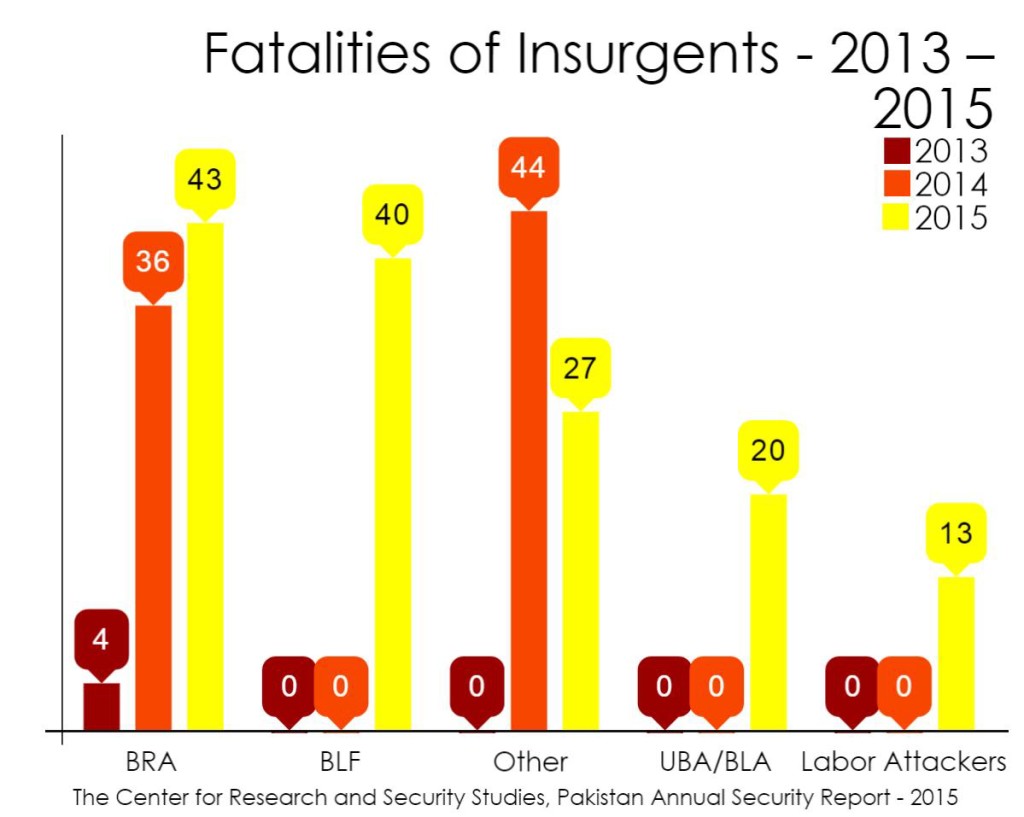
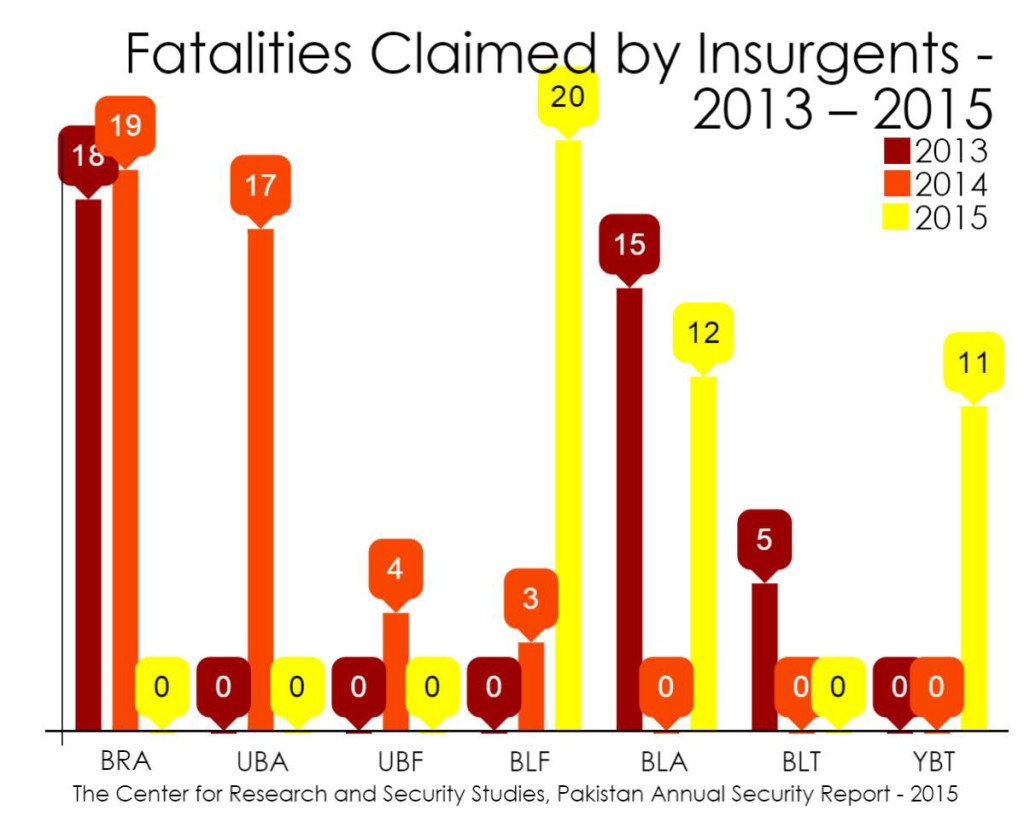
Baloch insurgents lost only four persons in 2013 and in the following years, the figure shot to 80 in 2014 and to 143 in 2015. On the other hand, the number of persons these groups have claimed to have killed is 124.
| Table 15: Fatalities claimed by insurgents – 2013 – 2015 | ||||
| Claimants | 2013 | 2014 | 2015 | Total |
| BRA | 18 | 19 | 0 | 37 |
| UBA | 0 | 17 | 0 | 17 |
| UBF | 0 | 4 | 0 | 4 |
| BLF | 0 | 3 | 20 | 23 |
| BLA | 15 | 0 | 12 | 27 |
| BLT | 5 | 0 | 0 | 5 |
| YBT | 0 | 0 | 11 | 11 |
| Total | 38 | 43 | 43 | 124 |
Criminals:
The term “criminals” being used here denotes target killers, gangsters, and robbers. During 2013-2015 as many as 1,316 criminals were killed in security operations and in the infighting between these groups for territorial control. The gang identification of 881 of these 1,316 criminals could be established. Some had links with political, religious and banned outfits as well. The number of gangs that lost their associates during this period is 57. In the year 2013, there were only 17 gangs who lost their members. During 2014, the number of gangs more than doubled to 39, and in 2015 it declined to 34. The fatalities of criminals went up from 68 in 2013 to 399 in 2014 and continued to climb with 414 in 2015 – underlining the impact of the anti-crime campaign, particularly in Karachi, since September 2013.
The province of Sindh recorded the highest number of fatalities of criminals (almost 80%) during the period, followed by Punjab (15%), Baluchistan and KP (3% each), Islamabad, AJK, and FATA (0.5% each). The province of Punjab recorded a very small number of criminal fatalities in 2013 (5). Among the criminals, the number of robbers killed was the highest – up from 169 in 2014 to 211 in 2015. Unlike the militants, criminal gangs never claim responsibility for any crime.
Nature and Methods of Violence Used
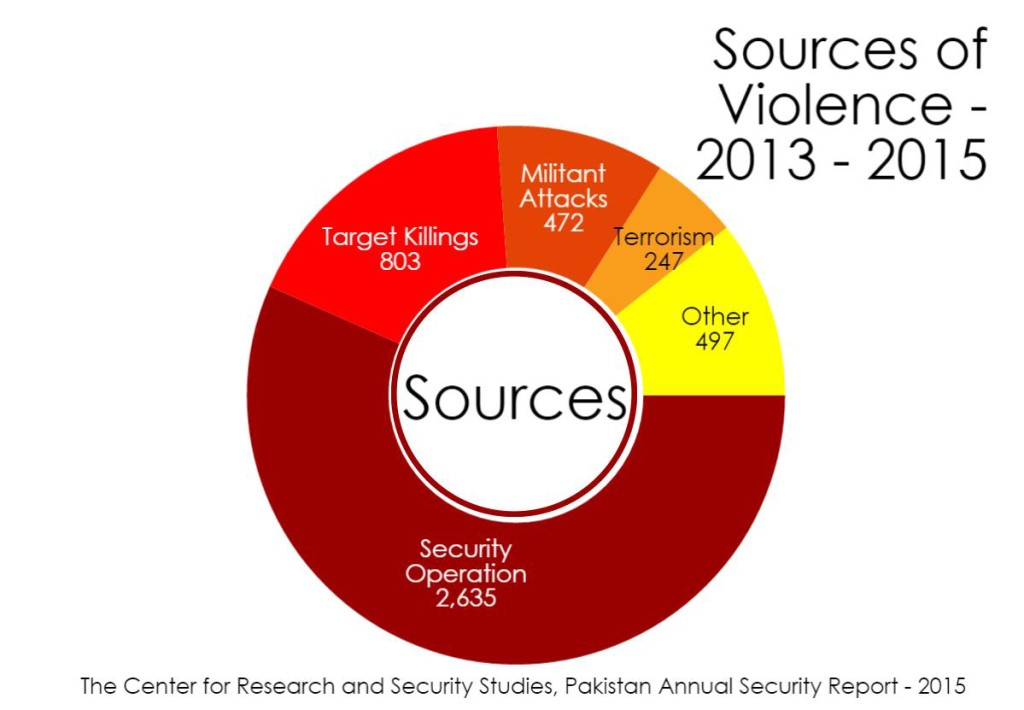
While the fatalities from security operations went up, those from militant attacks and terrorism went down by almost 50% in 2015. Target killings declined by over 150% in the country. At the same time robberies recorded an upsurge and with that the fatalities (71 in 2014 to 96 in 2015). In retaliation to robbery incidents, people too reacted with violence and resorted to lynching of robbers as and when they got hold of them, resulting in the death of 20. Almost the same number of lynching incidents was recorded in 2015 – underlining that indifference by and frustration with law enforcement agencies, people at large are increasingly resorting to take law in their hands.
Simultaneously, the number of innocent persons who lost their lives resisting robbery was 25 and 8 in 2014 and 2015 respectively. Certain acts of terrorism also resulted in accidental explosions and in some cases the suicide bombers opted for self-detonation without hitting the target. Such incidents left 24 persons dead during the last two years. Intra-group fights among militants and gangsters also left 547 persons dead but the occurrences of such incidents declined in the year 2015.
Cross-border attacks by militants who had escaped to eastern and northeastern Afghanistan following the launch of Zarb-e-Azb also emerged as a new threat to Pakistani security forces. Such incidents left as many as 58 persons dead in 2014-2015. Militants also carried out public beheadings of some of their captives in 2015.
| Table 16 – Sources of violence – 2013 – 2015 | ||||
| Source | 2013 | 2014 | 2015 | Total |
| Security operation | 811 | 3391 | 2635 | 6837 |
| Target killings | 2371 | 2128 | 803 | 5302 |
| Militants attacks | 1171 | 976 | 472 | 2619 |
| Terrorism | 810 | 516 | 247 | 1573 |
| Others | 522 | 600 | 497 | 1619 |
| Total | 5685 | 7611 | 4654 | 17950 |
| Note: Other includes robberies, militant and criminal infighting, political rivalries, cross-border attacks, accidental explosions and self-detonations, militant justice, children playing with toy bombs and other brutality. | ||||
Terrorists and outlaws deployed different methods to achieve their objectives, suicide attacks, bomb explosions and detonation of improvised explosive devices (IED) being the most fatal and common of them. During the last three years, nearly 923 bomb explosions took place leaving 1,160 people dead. The number of bombs located and defused by the law enforcement agencies was 214. Likewise, IED and landmine explosions killed about 357 persons. The fatalities from suicide attacks were 1,088 in 109 attacks. There were also 93 mortar and 127 rocket attacks that left some 167 persons dead.
| Table 17: Comparative data on violence and counter violence – 2013 – 2015 | ||||||||||||
| Method | 2013 | 2014 | 2015 | Total | ||||||||
| No. of Incidents | Fatalities | Injuries | No. of Incidents | Fatalities | Injuries | No. of Incidents | Fatalities | Injuries | Total # of incident | Total Fatalities | Total Injuries | |
| Armed attack | 373 | 318 | 369 | 109 | 317 | 146 | 66 | 173 | 71 | 548 | 808 | 586 |
| Bomb explosion | 378 | 665 | 2029 | 425 | 311 | 1259 | 120 | 184 | 385 | 923 | 1160 | 3673 |
| Dead body | 381 | 607 | 0 | 339 | 549 | 0 | 152 | 211 | 0 | 872 | 1367 | 0 |
| Hand grenade | 94 | 40 | 255 | 91 | 55 | 258 | 25 | 15 | 93 | 210 | 110 | 606 |
| IED explosion | 97 | 95 | 287 | 100 | 126 | 258 | 52 | 46 | 114 | 249 | 267 | 659 |
| Indiscriminate firing | 9 | 14 | 14 | 47 | 317 | 331 | 25 | 81 | 53 | 81 | 412 | 398 |
| Landmines | 36 | 34 | 63 | 33 | 28 | 56 | 27 | 28 | 26 | 96 | 90 | 145 |
| Mortar | 10 | 17 | 12 | 80 | 48 | 35 | 3 | 5 | 1 | 93 | 70 | 48 |
| Rocket attacks | 43 | 29 | 62 | 74 | 44 | 35 | 10 | 24 | 15 | 127 | 97 | 112 |
| Suicide attack | 52 | 716 | 1299 | 35 | 195 | 504 | 22 | 177 | 431 | 109 | 1088 | 2234 |
| Encounter | 96 | 199 | 44 | 535 | 1129 | 137 | 462 | 972 | 98 | 1093 | 2300 | 279 |
| Air Raid | 25 | 215 | 45 | 103 | 1959 | 133 | 63 | 1094 | 77 | 191 | 3268 | 255 |
| Clash | 93 | 520 | 328 | 78 | 434 | 150 | 88 | 532 | 237 | 259 | 1486 | 715 |
| Gunned down | 1402 | 1843 | 508 | 1346 | 1657 | 258 | 550 | 674 | 72 | 3298 | 4174 | 838 |
| Others | 111 | 11 | 21 | 133 | 22 | 14 | 56 | 37 | 13 | 300 | 70 | 48 |
| Total | 3200 | 5323 | 5336 | 3528 | 7191 | 3574 | 1721 | 4253 | 1686 | 8449 | 16767 | 10596 |
| Note: Other includes defused IEDs/bombs, hangings by militants, succumbing to injuries, toy bomb explosions. | ||||||||||||
From the tables and graphs above, it is evident that suicide attack, indiscriminate firing, bomb explosions and all other forms of detonations leave more people injured than dead. Even the air raids being carried out by the Air Force during the on-going Zarb-e-Azb operation don’t cause such level of injuries based on the reports issued by the government, though the veracity of claims around such raids and their consequences remain questionable.
Casualties of Violence in Baluchistan
In Baluchistan, target killings shrank by 30% and incidents of terrorism saw a 60% decline. The total fatalities in Baluchistan during 2013, 2014, and 2015 were 949, 752, and 719 respectively. These figures include the fatalities from security operations as well.
| Table B1: Balochistan fatalities from violence – 2013 – 2015 | |||
| Nature of violence | 2013 | 2014 | 2015 |
| Security operation | 102 | 216 | 314 |
| Target killings | 319 | 236 | 183 |
| Militant attacks | 312 | 185 | 85 |
| Terrorism | 206 | 76 | 48 |
| Killings after kidnapping | 9 | 39 | 89 |
| Total | 948 | 752 | 719 |
| Note: Other includes infighting between UBA and BLA as well as drug dealers, robberies, cross-border attacks, militant justice, custodial deaths, self-detonation, accidental explosions, ethnic killings, tribal feuds, and police rivalries. | |||
The district level fatalities from violence between 2013 and 2015 show that the number of districts affected from violence has decreased from 38 in 2013 to 34 in 2015. While the district of Quetta witnessed a significant decline in fatalities from violence from 2013 onward, an upsurge was observed in districts Kech, Kalat, Awaran, Mastung, and Panjgur during the last two years.
| Table B2: Balochistan fatalities by districts – 2013 to 2015 | |||
| Districts | 2013 | 2014 | 2015 |
| Quetta | 474 | 170 | 106 |
| Kech (Turbat) | 51 | 85 | 80 |
| Kalat | 24 | 37 | 75 |
| Awaran | 6 | 20 | 67 |
| Mastung | 14 | 46 | 51 |
| Dera Bugti | 54 | 79 | 47 |
| Panjgur | 22 | 37 | 38 |
| Gwadar | 29 | 3 | 30 |
| Bolan | 64 | 20 | 26 |
| Chaghi (Taftan) | 1 | 33 | 26 |
| Loralai | 1 | 7 | 26 |
| Khuzdar | 45 | 58 | 22 |
| Nasirabad | 34 | 30 | 19 |
| Kharan | 7 | 2 | 18 |
| Noshki | 0 | 7 | 12 |
| Pasni | 0 | 2 | 10 |
| Sibi | 35 | 26 | 8 |
| Barkhan | 2 | 1 | 7 |
| Pishin | 10 | 18 | 7 |
| Zhob | 4 | 4 | 7 |
| Ziarat | 1 | 3 | 7 |
| Killa Abdullah | 38 | 11 | 5 |
| Kohlu | 1 | 0 | 4 |
| Jafferabad | 0 | 9 | 3 |
| Jhal Magsi | 7 | 7 | 3 |
| Baseema | 0 | 0 | 2 |
| Chaman | 0 | 0 | 2 |
| Hub | 4 | 0 | 2 |
| Kuclak | 1 | 2 | 2 |
| Lasbella | 0 | 10 | 2 |
| Washuk | 3 | 19 | 2 |
| Kachi | 0 | 0 | 1 |
| Killa Saifullah | 3 | 1 | 1 |
| Konarak Coastal | 0 | 0 | 1 |
| Dera Allah Yar | 8 | 0 | 0 |
| Dera Murad Jamali | 3 | 0 | 0 |
| Dhadar | 0 | 1 | 0 |
| Harnai | 1 | 1 | 0 |
| Lehri | 1 | 0 | 0 |
| Mand | 0 | 2 | 0 |
| Mashkhail | 0 | 1 | 0 |
| Sohbatpur | 1 | 0 | 0 |
| Total | 949 | 752 | 719 |
The table below reflects the number of civilians[1], security officials[2], government officials[3], and outlaws[4] that were victims of violence during the three years this report covers.
| Table B3 – Balochistan victims of violence – 2013 – 2015 | ||||
| Victims | 2013 | 2014 | 2015 | Total |
| Civilians | 625 | 307 | 275 | 1207 |
| Militants | 107 | 214 | 215 | 536 |
| Insurgents | 3 | 29 | 114 | 146 |
| Security officials | 116 | 96 | 76 | 288 |
| Other | 84 | 106 | 39 | 229 |
| Total | 935 | 752 | 719 | 2406 |
| Note: Other includes criminals, religious persons, religious and political party activists, foreigners, media persons, government officials and unknown. | ||||
Based on the categories of civilians, security and government officials, and outlaws, we assess the overall law and order situation in every province. The higher number of fatalities of civilians and security officials, in our assessment, reflect the general law and order situation in a province. In Balochistan, it began improving and in the year 2015 it reached a level that can be considered as satisfactory.
| Table B4 – Balochistan victims of violence percentages – 2013 – 2015 | |||
| Victims | Percentage of total fatalities | ||
| 2013 | 2014 | 2015 | |
| Militants, criminals, insurgents | 12% | 35% | 45% |
| Civilians, security and government officials | 88% | 65% | 55% |
Casualties of Violence in FATA
In FATA, the fatalities from violence dropped significantly this year. North Waziristan and Khyber Agencies suffered the highest number of fatalities, primarily because of the ongoing Operation Zarb-e-Azb. Last year, the government cleared many areas in Khyber Agency from militants and allowed refugees to return to their residence. The famous Bara Bazar was also opened for business after remaining closed for many years due to the militancy in the area.
| Table F1: FATA fatalities by agencies – 2013 to 2015 | |||
| Agencies | 2013 | 2014 | 2015 |
| North Waziristan | 355 | 1790 | 814 |
| Khyber Agency | 725 | 1184 | 752 |
| South Waziristan | 51 | 84 | 98 |
| Kurrum Agency | 174 | 27 | 90 |
| Orakzai | 113 | 125 | 74 |
| Mohmand | 14 | 98 | 51 |
| Bajaur | 28 | 63 | 38 |
| Total | 1460 | 3371 | 1917 |
In last three years, the fatalities of militants were the highest among all other victims while the next most affected category was that of unknown civilians and those who were identified as religious persons, religious party activists, political party activists and media persons. Among the militant victims, 44 were identified as Uzbeks who were killed after the attack on Karachi Airport on 10 June, 2014. This attack was claimed by the Islamic Movement of Uzbekistan (IMU).
| Table F2: FATA victims of violence – 2013 – 2015 | |||
| Victims | 2013 | 2014 | 2015 |
| Militants | 989 | 2828 | 1671 |
| Civilians | 244 | 273 | 126 |
| Security officials | 187 | 263 | 112 |
| Other | 40 | 7 | 8 |
| Total | 1460 | 3371 | 1917 |
| Note: Other includes government officials, religious persons, religious and political party activists, media persons, foreigners and criminals. | |||
The major cause of deaths in FATA were air raids carried out by PAF under Operation Zarb-e-Azb. The methods of violence used by the militants in FATA included usage of bombs and other explosive devices, as well as mortar and rocket attacks. In one case, a missile attack was also carried out from across the border region of Afghanistan (close to Bajaur Agency) by the Pakistani-based militants who had migrated post Zarb-e-Azb. Beheading of soldiers and tribesmen was also carried out by the militants in FATA regions before and after Zarb-e-Azb that resulted in the death of 30 persons.
| Table F3: FATA fatalities from violence – 2013 – 2015 | ||||
| Nature of violence | 2013 | 2014 | 2015 | Total |
| Air raids | 169 | 1937 | 1082 | 3188 |
| Clashes with LEAs | 486 | 366 | 388 | 1240 |
| Ground operation | 10 | 8 | 92 | 110 |
| Bombs | 129 | 57 | 84 | 270 |
| Drone attacks | 160 | 160 | 65 | 385 |
| Armed attacks | 70 | 198 | 59 | 327 |
| Other | 436 | 645 | 147 | 1228 |
| Total | 1460 | 3371 | 1917 | 6748 |
| Note: Other includes IEDs, landmines, suicide attacks, rocket, missile, mortar and hand grenade attacks, accidental explosions, heavy artillery, shell explosions and toy bombs; encounter with LEAs, beheadings, hangings and public executions by militants; succumbing to injuries; stoning; and other forms of killings. | ||||
The fatalities from violence and the military operation witnessed a significant drop in FATA during the year 2015. An over 35% drop in fatalities from security operation was recorded in 2015 while the occurrences of crimes like terrorism and militant attacks reduced drastically during the year 2015. The cross-border attacks in different forms increased significantly in the year 2014 and 2015, as militants fled the operation to the relative safety of Afghanistan. Infighting among different groups of TTP and pro-government peace militia also continued.
| Table F4: FATA fatalities from violence – 2013 – 2015 | |||
| Nature of violence | 2013 | 2014 | 2015 |
| Security operation | 470 | 2372 | 1500 |
| Terrorism | 199 | 221 | 111 |
| Militants’ attack | 291 | 299 | 101 |
| Infighting – Various | 240 | 106 | 69 |
| Drone attacks | 160 | 160 | 65 |
| Other | 110 | 213 | 61 |
| Total | 1460 | 3371 | 1917 |
| Note: Other includes target killings, cross-border attacks, tribal justice, robberies, suspected security operation, tribal feuds, killings after being kidnapped, and toy bomb explosions. | |||
Overall, the law and order situation in FATA regions appears to have improved significantly. From a 32% of the total fatalities of civilians and security officials back in 2013, the percentage fell down to 12% in 2015. The fatalities of militants, on the other hand, went up from 68% in 2013 to 88% in 2015.
| Table F5 – FATA victims of violence percentages – 2013 – 2015 | |||
| Victims | Percentage of total fatalities | ||
| 2013 | 2014 | 2015 | |
| Militants, criminals, insurgents | 68% | 83% | 88% |
| Civilians, security officials | 32% | 17% | 12% |
Casualties of Violence in KP
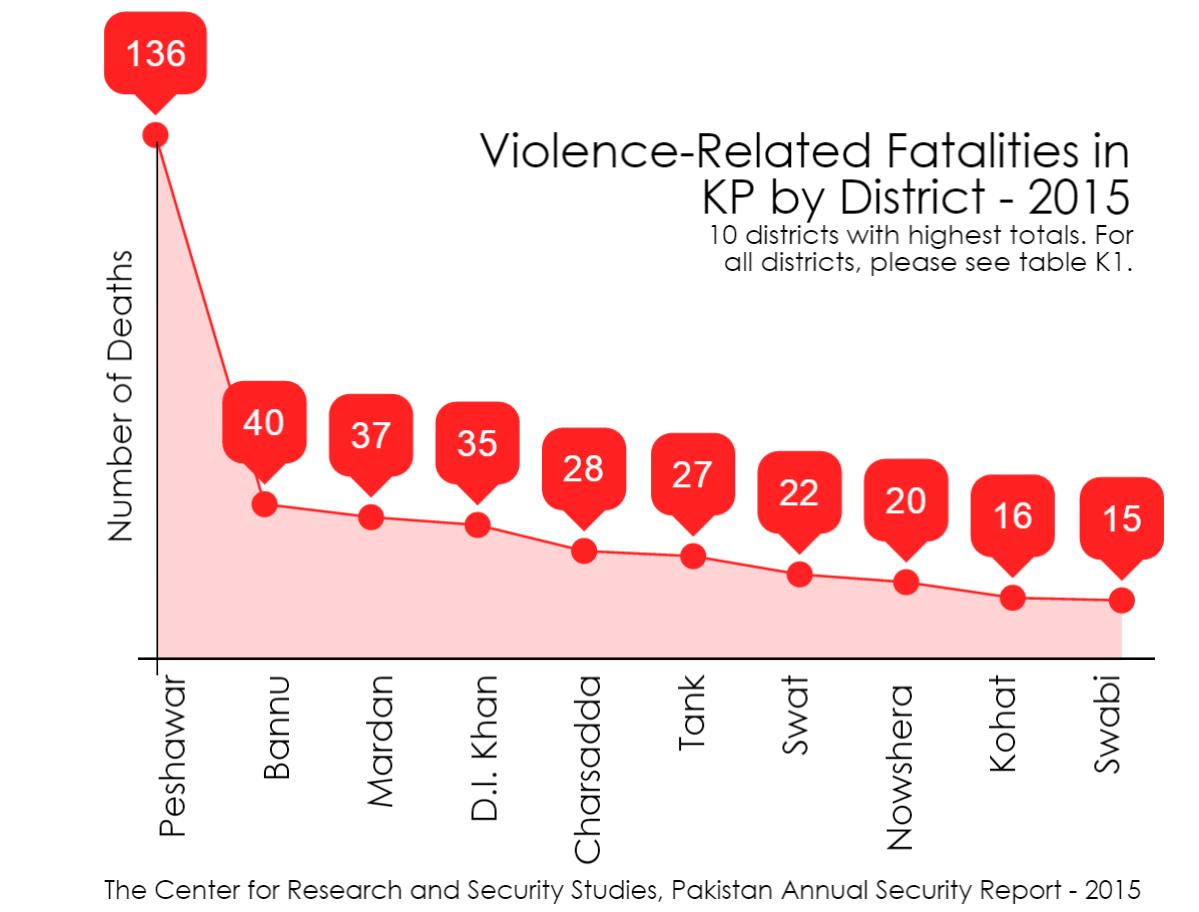
There were 51 incidents of violence in 2015 that left 136 persons dead in Peshawar city alone. A full breakdown by districts is below.
| Table K1: KP fatalities by districts – 2013 to 2015 | |||
| Districts | 2013 | 2014 | 2015 |
| Peshawar | 422 | 427 | 136 |
| Bannu | 43 | 61 | 40 |
| Mardan | 51 | 30 | 37 |
| D.I. Khan | 56 | 62 | 35 |
| Charsadda | 21 | 35 | 28 |
| Tank | 8 | 15 | 27 |
| Swat | 23 | 55 | 22 |
| Nowshera | 31 | 26 | 20 |
| Kohat | 58 | 54 | 16 |
| Swabi | 30 | 20 | 15 |
| Mansehra | 8 | 16 | 13 |
| Haripur | 0 | 0 | 12 |
| Hangu | 129 | 76 | 9 |
| Lakki Marwat | 51 | 7 | 7 |
| Karak | 11 | 2 | 6 |
| Malakand (Batkhela) | 31 | 8 | 6 |
| Dir | 23 | 26 | 5 |
| Buner | 8 | 7 | 4 |
| Batkhela | 0 | 0 | 1 |
| Bisham | 1 | 0 | 1 |
| Khanpur | 0 | 0 | 1 |
| Abbottabad | 0 | 4 | 0 |
| Alpuri (Shangla) | 8 | 5 | 0 |
| Battagram | 0 | 2 | 0 |
| Chitral | 2 | 2 | 0 |
| Darra Adam Khel | 10 | 0 | 0 |
| Sakhakot | 2 | 0 | 0 |
| Total | 1027 | 940 | 441 |
The fatalities from violence in Peshawar dropped significantly in 2015 as compared to the figure of 2014. Two major terrorist attacks had left 50 persons dead in Peshawar in 2015. Here are the details of these attacks:
An anatomy of all violent incidents in Peshawar during 2015 reveals that there were 67 fatalities from militant attacks, followed by target killings (37), political rivalry (13), terrorism (13), and 3 persons were killed during a robbery. There was one bomb explosion (1), followed by two armed attacks (43), and two suicide attacks (22). These five incidents can be categorized as terrorist attacks.
No doubt, there has been a noticeable decline in fatalities from different methods of violence used in KP during the last three years. Compared to last year, the fatalities from suicide and armed attacks witnessed an upsurge in 2015 while the incidents of robbery-related fatalities also went up during 2015. Like FATA, the incidents of beheading were also reported from KP in 2013 and 2015. However, overall, there is a marked and significant decline in violence-related deaths.
| Table K2: KP fatalities from violence – 2013 – 2015 | |||
| Nature of violence | 2013 | 2014 | 2015 |
| Gunned down | 176 | 271 | 137 |
| LEA encounter | 20 | 84 | 61 |
| Armed attacks | 110 | 40 | 57 |
| Suicide attacks | 307 | 41 | 50 |
| Dead body found | 48 | 71 | 28 |
| Clashes with LEAs | 28 | 21 | 27 |
| Indiscriminate shooting | 7 | 175 | 11 |
| Other | 331 | 237 | 70 |
| Total | 1027 | 940 | 441 |
| Note: Other includes hand grenade, rocket, and mortar attacks; suicide, toy bomb, IED, accidental and landmine explosions; air raids, ground operations, LEA encounters and police raids; protests, defused bombs, jail breaks and cross-border attacks; robberies, and other forms of killings; custodial deaths; beheadings and executions by militants. | |||
Although the fatalities from violence saw a sharp decline in the year 2015, the beneficiaries of this drop were not only civilians, but militants and criminals as well. While the fatalities of religious persons in KP came down from 16 persons in 2014 to two persons in 2015, the religious parties did not have any decline in loss of their activists in 2015. In case of political parties, their activists suffered more loss of lives in 2015 compared to 2014.
| Table K3: KP victims of violence – 2013 – 2015 | |||
| Victims | 2013 | 2014 | 2015 |
| Civilians | 412 | 571 | 174 |
| Security officials | 174 | 139 | 101 |
| Militants | 171 | 144 | 82 |
| Political Party Activists | 78 | 23 | 32 |
| Others | 192 | 63 | 52 |
| Total | 1027 | 940 | 441 |
| Note: Other includes government officials, religious persons, religious party activists, media persons, foreigners/diplomats, criminals and victims of attacks on government and public property. | |||
Despite the decline in violence, the relative percentage of casualties for either side of the law remains largely the same.
| Table K4 – KP victims of violence percentages – 2013 – 2015 | |||
| Victims | Percentage of total fatalities | ||
| 2013 | 2014 | 2015 | |
| Militants, criminals, insurgents | 18% | 17% | 21% |
| Civilians, security officials | 82% | 83% | 79% |
Casualties of Violence in Punjab
The least affected of violence is the most populated province of the country, Punjab. It is the only province in the country that saw an upsurge in number of fatalities from violence during last two years. However, it accounts for a mere 4% of all violence-related national fatalities, despite accounting for nearly 2/3rd of the population.
Out of 17,958 persons (including militants) that were the victims of violence in the country during last three years, 755 persons were from the Punjab. In 2013, all in all 21 districts were reported to have had experienced violence but only six districts had more than five fatalities from violence during the year. In 2014, the number of affected districts went up to 26 and only 12 of them suffered 5 or more than 5 fatalities during the year. The number of affected districts were 27 and 16 of them counted more than 5 fatalities in 2015.
| Table P1: Punjab fatalities by districts – 2013 to 2015 | |||
| Districts | 2013 | 2014 | 2015 |
| Lahore | 29 | 125 | 69 |
| Faisalabad | 6 | 35 | 36 |
| Rawalpindi | 28 | 31 | 17 |
| Bahawalpur | 4 | 17 | 19 |
| Gujranwala | 10 | 16 | 10 |
| Muzaffargarh | 2 | 15 | 20 |
| Multan | 3 | 8 | 15 |
| Okara (Renala Khurd) | 0 | 7 | 23 |
| Dera Ghazi Khan | 2 | 5 | 21 |
| Nankana | 0 | 5 | 8 |
| Rajanpur | 1 | 5 | 0 |
| Sargodha | 1 | 5 | 5 |
| Gujrat (Lalamusa) | 10 | 4 | 2 |
| Rahim Yar Khan | 2 | 4 | 1 |
| Attock | 1 | 3 | 24 |
| Jhelum | 0 | 3 | 0 |
| Layyah | 0 | 3 | 0 |
| Wah Cantt | 0 | 3 | 1 |
| Hafizabad | 3 | 2 | 2 |
| Jhang | 2 | 2 | 1 |
| Khanewal | 0 | 2 | 0 |
| Mandi Bahauddin | 0 | 1 | 0 |
| Mianwali | 0 | 1 | 0 |
| Pakpattan | 0 | 1 | 3 |
| Sialkot | 0 | 1 | 3 |
| Taxila | 0 | 1 | 0 |
| Bahawalnagar | 0 | 0 | 1 |
| Bhakkar | 7 | 0 | 0 |
| Burewala | 0 | 0 | 1 |
| Chakwal | 1 | 0 | 0 |
| Chiniot | 1 | 0 | 0 |
| Daska | 0 | 0 | 3 |
| Jaranwala | 3 | 0 | 2 |
| Kasur | 0 | 0 | 15 |
| Sadiqabad | 0 | 0 | 12 |
| Sahiwal | 2 | 0 | 0 |
| Sheikhupura | 0 | 0 | 7 |
| Toba Tek Singh | 3 | 0 | 7 |
| Vehari | 1 | 0 | 0 |
| Total | 122 | 305 | 328 |
In the last three years, the highest causes of fatalities in the Punjab were because of security operations, target killings, and militant attacks. The fatalities from militant attacks went up in 2014 and in 2015 there was no significant drop in this crime. However, the fatalities from target killings went down from 95 in 2014 to 27 in 2015. The robbery-related fatalities continued unabatedly, triggering violent reactions from the victims that resulted in lynching of five robbers. Three robbers were killed when the victims fought back.
| Table P2: Punjab fatalities from violence – 2013 – 2015 | |||
| Nature of violence | 2013 | 2014 | 2015 |
| Security operation | 11 | 78 | 176 |
| Militant attacks | 15 | 83 | 79 |
| Target killings | 62 | 95 | 27 |
| Robberies | 0 | 16 | 16 |
| Political rivalries | 9 | 0 | 15 |
| Other | 25 | 33 | 15 |
| Total | 122 | 305 | 328 |
| Note: Other includes custodial deaths, lynching, terrorism, resistance to robbery, customs operation, self-detonation, sectarian rivalry, arson, cross-border attack from across the LoC, tribal feud and killing after kidnapping. | |||
The civilians were the biggest victims of violence in the Punjab, followed by criminals, militants, security officials, and others. A number of activists of political and religious parties also fell victims to violence and as did religious persons belonging to different sects.
| Table P3: Punjab victims of violence – 2013 – 2015 | |||
| Victims | 2013 | 2014 | 2015 |
| Criminals | 5 | 74 | 121 |
| Civilians | 62 | 145 | 86 |
| Militants | 0 | 18 | 76 |
| Political party activists | 14 | 3 | 25 |
| Other | 41 | 65 | 20 |
| Total | 122 | 305 | 328 |
| Note: Other includes security and government officials, religious persons and religious party activists, media persons, foreigners and unknown individuals. | |||
The overall law and order situation in the Punjab appears to be decent, despite an increase in overall number of fatalities.
| Table P4 – Punjab victims of violence percentages – 2013 – 2015 | |||
| Victims | Percentage of total fatalities | ||
| 2013 | 2014 | 2015 | |
| Militants, criminals, insurgents | 4% | 30% | 60% |
| Civilians, security officials | 96% | 70% | 40% |
Casualties of Violence in Sindh
CRSS data for the last three years shows a nearly 78% reduction in crime achieved in Sindh, while Karachi witnessed a 48% drop in the fatalities from different forms of violence in the year 2015. In last three years, Karachi lost 5,063 persons.
| Table S1: Sindh fatalities by districts – 2013 to 2015 | |||
| Districts | 2013 | 2014 | 2015 |
| Karachi | 2000 | 2023 | 1040 |
| Shikarpur | 2 | 1 | 72 |
| Sukkur | 30 | 66 | 30 |
| Jacobabad | 0 | 1 | 29 |
| Khairpur | 4 | 9 | 12 |
| Mirpur Khas | 1 | 4 | 11 |
| Hyderabad | 20 | 37 | 5 |
| Nawabshah | 4 | 4 | 5 |
| Ghotki | 0 | 0 | 4 |
| Pano Aqil | 0 | 0 | 4 |
| Sanghar | 0 | 0 | 4 |
| Umerkot | 0 | 3 | 3 |
| Larkana | 2 | 7 | 2 |
| Dadu | 0 | 3 | 0 |
| Jamshoro | 2 | 1 | 0 |
| Kashmore (Kandhkot) | 9 | 13 | 0 |
| Nausheroferoz | 0 | 5 | 0 |
| Shahdadkot | 5 | 0 | 0 |
| Shahdadpur | 0 | 3 | 0 |
| Thatta (Dhabeji | 5 | 6 | 0 |
| Total | 2084 | 2186 | 1221 |
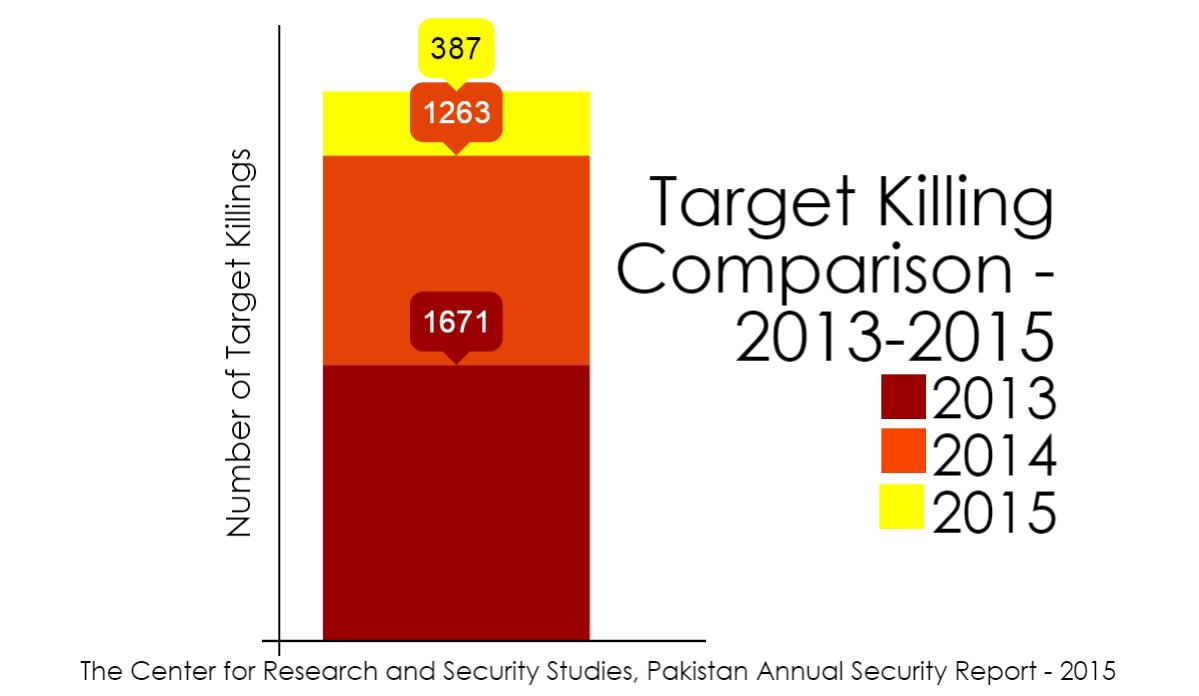
In 2014, there was 25% reduction in target killings over 2013, and in 2015, target killings were at at 23% of their 2013 value. The incident of militant attacks reduced by 10% in 2015 after witnessing more than a 70% escalation in 2014. There were reports of infighting among different gangster, militant and activist groups that resulted in 72 fatalities between 2013 and 2015.
The incidents of robberies went up during last two years and left 111 persons dead. This crime resulted in leading people to react and resist in different ways. As many as 35 persons were subjected to lynching by the mob when they were caught. Another 27 persons were put to death when the victims of robbery resisted. So, altogether 173 persons lost their lives within last two years in Karachi in robbery-related incidents.
| Table S2: Sindh fatalities from violence – 2013 – 2015 | |||
| Nature of violence | 2013 | 2014 | 2015 |
| Security Operation | 137 | 613 | 554 |
| Target Killings | 1671 | 1263 | 387 |
| Militants’ attack | 68 | 110 | 92 |
| Terrorism | 170 | 40 | 71 |
| Robbery | 0 | 52 | 59 |
| Political rivalry | 7 | 0 | 20 |
| Lynching | 0 | 20 | 15 |
| Other | 30 | 87 | 23 |
| Total | 2083 | 2185 | 1221 |
| Note: Other includes Infighting, resistance to robbery, custodial deaths, toy bomb explosions, tribal feud, arson, killing after kidnapping, and extortion. | |||
CRSS data shows some 545 fatalities of militants and criminals in 2015 as a result of police encounters. In addition, there were about 30 fatalities of these outlaws because of their infighting, target killings of one other, lynching incidents of robbers, and resistance to robbery.
Bomb explosions, landmines, improvise explosive devices (IEDs) , armed, rocket, and suicide attacks were the methods of violence that were used in the province during the last three years. The fatalities from all such incidents dropped significantly in the year 2015 with the exception of suicide attacks. The majority of these suicide attacks were reported from Karachi while districts of Sukkur and Jacobabad also suffered some of these attacks. As many as 3,410 persons that are identified as civilians, political and religious party activists became victims of violence during the last three years. These were followed by outlaws (militants, criminals, insurgents, and kidnappers) at 1,538 while security and government officials stood at 541.
| Table S3: Sindh victims of violence – 2013 – 2015 | |||
| Victims | 2013 | 2014 | 2015 |
| Criminals | 155 | 486 | 394 |
| Civilians | 1169 | 992 | 370 |
| Militants | 63 | 231 | 181 |
| Security officials | 197 | 210 | 113 |
| Other | 499 | 266 | 163 |
| Total | 2083 | 2185 | 1221 |
| Note: Other includes government officials, political and religious party activists, media persons, foreigners and insurgents and kidnappers, as well as unknown persons. | |||
The over-all law and order situation in Sindh appears to have improved significantly in 2015. The percentages on either side of the law also reflects this.
| Table S4 – Sindh victims of violence percentages – 2013 – 2015 | |||
| Victims | Percentage of total fatalities | ||
| 2013 | 2014 | 2015 | |
| Militants, criminals, insurgents | 11% | 33% | 47% |
| Civilians, security officials | 89% | 67% | 53% |
A 2013-2015 comparison of target killings in Sindh is below.
Casualties of Violence in Islamabad, AJK, and GB
As many as 113 persons were victims in AJK, Islamabad, and Gb between 2013 and 2015.
| Table O1: AJK, ISB, and GB fatalities – 2013 to 2015 | |||
| Region | 2013 | 2014 | 2015 |
| AJK | 3 | 6 | 0 |
| ISB | 20 | 48 | 10 |
| GB | 20 | 3 | 3 |
| Total | 43 | 57 | 13 |
Sectarian Violence in Pakistan
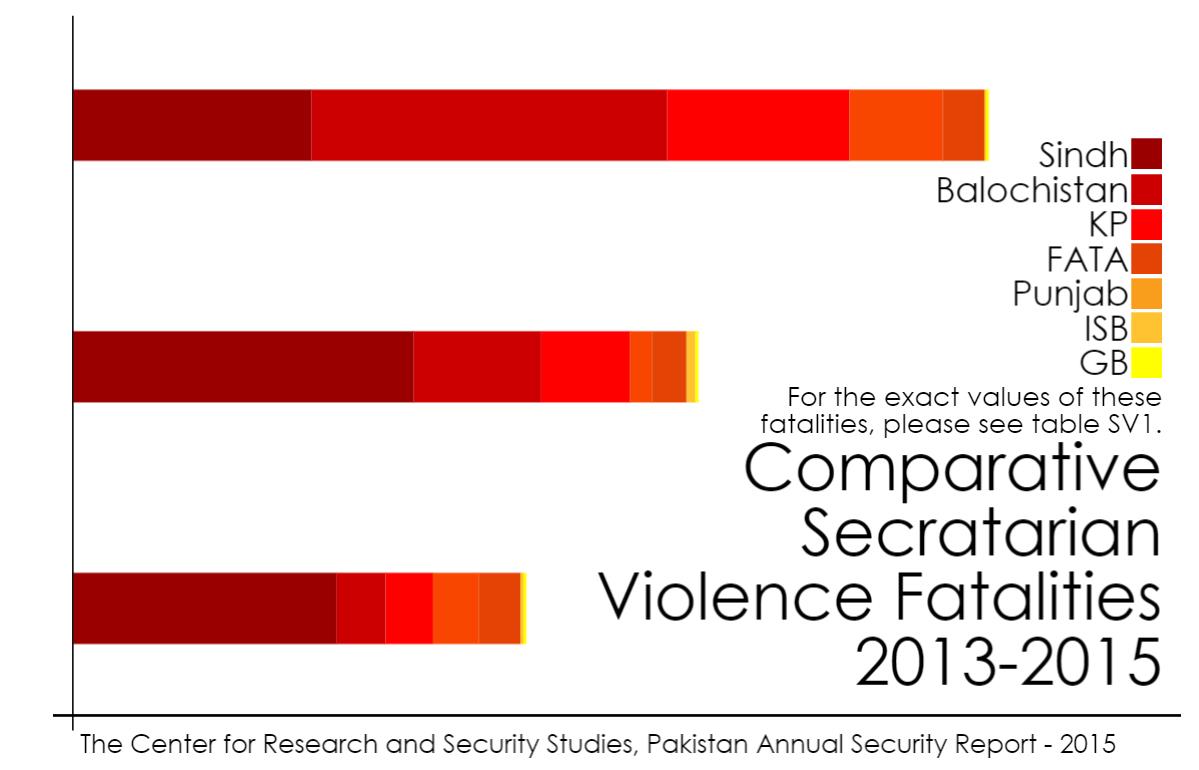
Sectarian violence claimed about 1340 lives and left some 1940 injured) during the last three years. The province of Sindh had the highest number of sectarian fatalities (569), followed by Baluchistan (359), KP (215), FATA (109), and Punjab (79). The capital of the country, Islamabad, also suffered nine fatalities. Baluchistan faced the highest number of injured people in sectarian violence (608).
| Table SV1: Sectarian violence fatalities – 2013 – 2015 | ||||||
| Region | 2013 | 2014 | 2015 | |||
| Dead | Injured | Dead | Injured | Dead | Injured | |
| Sindh | 161 | 129 | 230 | 67 | 178 | 131 |
| Balochistan | 240 | 424 | 86 | 153 | 33 | 31 |
| KP | 123 | 195 | 60 | 104 | 32 | 63 |
| FATA | 63 | 200 | 15 | 31 | 31 | 76 |
| Punjab | 28 | 113 | 23 | 24 | 28 | 99 |
| ISB | 1 | 0 | 6 | 98 | 2 | 1 |
| GB | 0 | 0 | 0 | 1 | 0 | 0 |
| Total | 616 | 1061 | 420 | 478 | 304 | 401 |
A downward trend, as observed in all other forms of violence, is evident in sectarian violence as well. More than a 50% drop in fatalities off sectarian violence is visible in 2015 when compared with those in 2013. However, a noticeable change was observed in the number of districts that were affected of this violence; from 15 affected districts in 2013 the number went up to 40 in 2014 and then came down to 17 districts in 2015. The table below explains the geographical spread of the phenomenon of sectarian violence.
| Table SV2: Sectarian violence fatalities by districts – 2013 to 2015 | ||||
| Districts | 2013 | 2014 | 2015 | Total |
| Quetta | 233 | 27 | 19 | 279 |
| Karachi | 160 | 216 | 86 | 462 |
| Peshawar | 89 | 38 | 29 | 156 |
| Kurram Agency | 60 | 0 | 25 | 85 |
| Hangu | 33 | 1 | 0 | 34 |
| Rawalpindi | 12 | 4 | 9 | 25 |
| Bhakkar | 7 | 0 | 0 | 7 |
| Lahore | 4 | 2 | 17 | 23 |
| Gujrat | 3 | 0 | 0 | 3 |
| Khyber | 2 | 3 | 0 | 5 |
| Rahimyar Khan | 2 | 1 | 0 | 3 |
| Chiniot | 1 | 0 | 0 | 1 |
| Islamabad | 1 | 6 | 2 | 9 |
| Nawabshah | 1 | 1 | 0 | 2 |
| Swabi | 1 | 0 | 0 | 1 |
| Abbottabad | 0 | 2 | 0 | 2 |
| Attock | 0 | 1 | 0 | 1 |
| Awaran | 0 | 6 | 0 | 6 |
| Bahawalpur | 0 | 1 | 0 | 1 |
| Bajaur | 0 | 1 | 0 | 1 |
| Bannu | 0 | 1 | 0 | 1 |
| Battagram | 0 | 1 | 0 | 1 |
| Bolan | 7 | 1 | 12 | 20 |
| Chaghi | 0 | 30 | 0 | 30 |
| Charsadda | 0 | 3 | 0 | 3 |
| D.I. Khan | 0 | 0 | 1 | 1 |
| Faisalabad | 0 | 1 | 0 | 1 |
| Gujranwala | 0 | 4 | 0 | 4 |
| Gwadar | 0 | 0 | 2 | 2 |
| Hyderabad | 0 | 5 | 0 | 5 |
| Jacobabad | 0 | 0 | 28 | 28 |
| Khairpur | 0 | 1 | 1 | 2 |
| Khuzdar | 0 | 0 | 0 | 0 |
| Kohat | 0 | 7 | 0 | 7 |
| Lalamusa | 0 | 1 | 0 | 1 |
| Malakand | 0 | 1 | 0 | 1 |
| Mandi Bahauddin | 0 | 1 | 0 | 1 |
| Mansehra | 0 | 4 | 1 | 5 |
| Mardan | 0 | 2 | 0 | 2 |
| Mastung | 0 | 22 | 0 | 22 |
| Mirpur Khas | 0 | 3 | 0 | 3 |
| Nowshera | 0 | 0 | 2 | 2 |
| Multan | 0 | 0 | 0 | 0 |
| Okara | 0 | 1 | 1 | 2 |
| Orakzai | 0 | 10 | 6 | 16 |
| Rajanpur | 0 | 1 | 0 | 1 |
| S. Waziristan | 0 | 1 | 0 | 1 |
| Taxila | 0 | 0 | 0 | 0 |
| Sargodha | 0 | 5 | 0 | 5 |
| Shikarpur | 0 | 1 | 63 | 64 |
| Sukkur | 0 | 1 | 0 | 1 |
| Umerkot | 0 | 2 | 0 | 2 |
| Total | 616 | 420 | 304 | 1340 |
Based on the identities of the victims of sectarian violence, the number of Sunni victims was 216 during last three years, 16% of the total fatalities from this violence during this period. The victims from minority population, estimated to be some 20% of the total population, were around 80% of the total fatalities.
| Table SV3: Sectarian violence fatalities by religion/sect – 2013 – 2015 | ||||
| Religion/Sect | 2013 | 2014 | 2015 | Total |
| Shia | 149 | 189 | 192 | 530 |
| Ismaili | 2 | 1 | 48 | 51 |
| Christian | 83 | 1 | 19 | 103 |
| Sunni | 53 | 145 | 18 | 216 |
| Shia Hazara | 206 | 35 | 16 | 257 |
| Unknown | 53 | 6 | 5 | 52 |
| Bohra | 1 | 1 | 3 | 5 |
| Hindu | 5 | 6 | 2 | 13 |
| Ahmadi | 4 | 8 | 1 | 13 |
| Shia/Sunni | 59 | 0 | 0 | 59 |
| Sufi | 0 | 19 | 0 | 19 |
| Sikh | 1 | 3 | 0 | 4 |
| Zikri | 0 | 6 | 0 | 6 |
| Total | 616 | 420 | 304 | 1340 |
A number of banned outfits claimed to had carried out sectarian violence during the last three years, spearheaded by LeJ and Jundullah. LeJ suffered a severe blow during 2015 when its chief, Malik Ishaq, and his 15 associates were killed in a police operation on 29 July, 2015.
| Table SV4: Sectarian violence fatality claimants – 2015 | |
| Claimant | 2015 |
| Unknown | 110 |
| TTP – Jundullah | 82 |
| Da’ish/Jundullah | 45 |
| Lashkar-e-Jhangvi (LeJ) | 40 |
| TTP-JA | 26 |
| TTP-J / LeJ | 1 |
| Total | 304 |
Comprehensive document of Annual Security Report can be downloaded from here :-
https://crss.pk///wp-content/uploads/2010/07/Annual-Report-2015-6.pdf
_______________________________________________________________________________
[1] Civilians: Unidentifiable civilians = A number of victims of violence are the common citizens without any
affiliation to any known organization. These people are simply identified as “civilians”.
Identifiable civilians are hose victims of violence that are associated with any known organization like political party, religious party, religious persons (example: prayer leader, religious scholar, preacher, etc), and religious places.
[2] Security officials: Personnel belonging to Army, Air Force, Frontier Core, Khassadar, and Levies
[3] Government officials: All those officials working in government department in different capacities.
[4] Outlaws: (militants, insurgents, and criminals fall in this category and they are defined as follows):
Militants = Associated with banned Jihadi groups like TTP, Al-Qaeda, Lashkar-e-Jhangvi and others. They challenge the writ of the government, make claim of committing crimes, and often attacks the civil population and security agencies with suicide attacks, hand grenades, rocket fires, and use other forms of fatal attacks. They operate and execute their attacks throughout the country.
Insurgents = Follows the same methods of violence as are committed by the militants with the exceptions that they are confined to Baluchistan only and they have separate identities than the militant groups.
Criminals = Target killers, gangsters, and robbers are included in this category. Unlike the militants and insurgents, they don’t claim of committing crimes and the weapons and methods they use for committing crimes are pistols and hand grenades. They don’t challenge the writ of the government either.

